FIRST YEAR TO SECOND YEAR RETENTION
Percent of first year students returning for the second year
| Entering Semester | Percent Returning |
|---|---|
| Fall 2024 | 97% |
| Fall 2023 | 99% |
| Fall 2022 | 99% |
| Fall 2021 | 98% |
| Fall 2020 | 95% |
| Fall 2019 | 100% |
| Fall 2018 | 98% |
| Fall 2017 | 97% |
| Fall 2016 | 95% |
| Fall 2015 | 98% |
| Fall 2014 | 95% |
| Fall 2013 | 98% |
| Fall 2012 | 94% |
| Fall 2011 | 93% |
| Fall 2010 | 95% |
| Fall 2009 | 93% |
| Fall 2008 | 93% |
| AVERAGE | 96% |
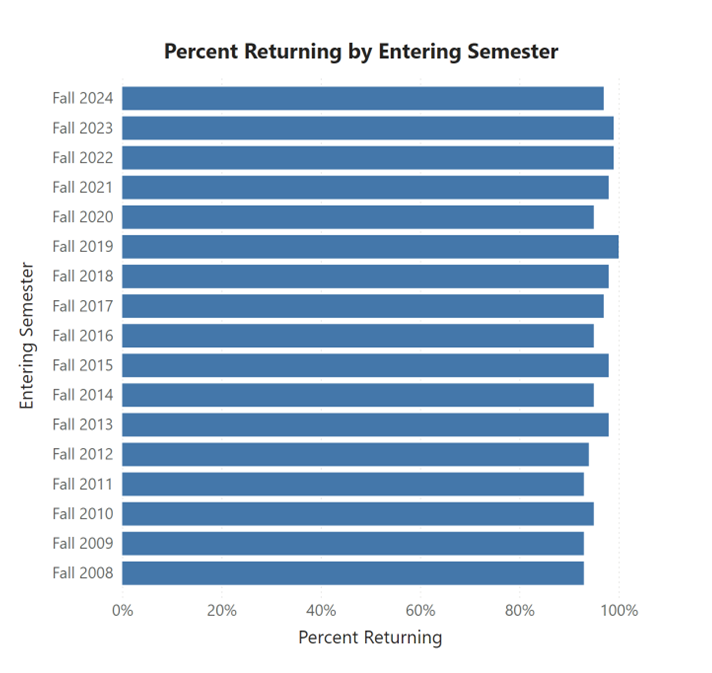
Source: Regimental Information System
GRADUATION RATES
Percent of students graduating in 100%, 150% and 200% of normal time
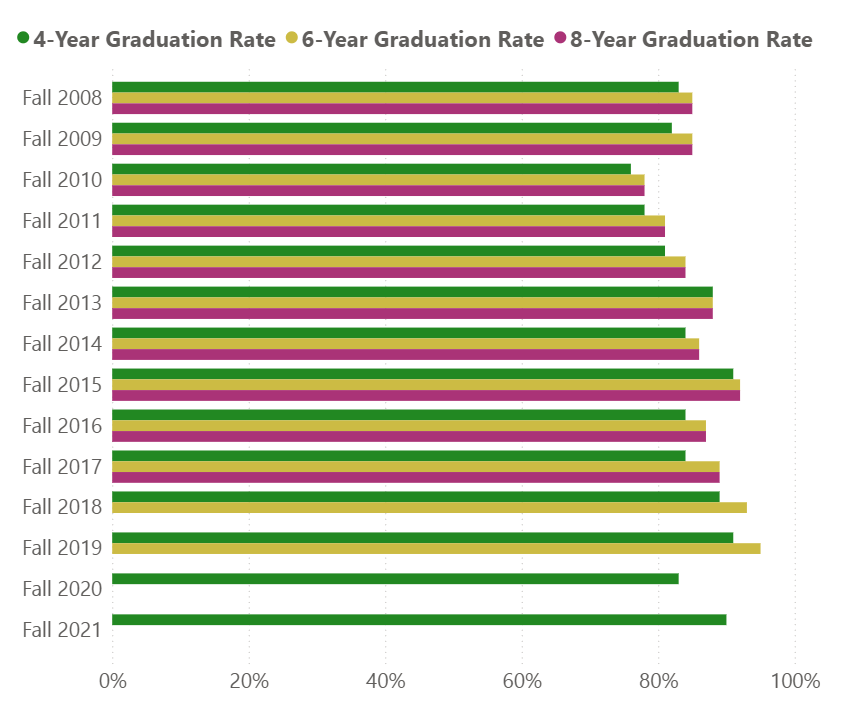
| Percent Graduating in | |||
|---|---|---|---|
| Entering Semester | 4 Years | 6 Years | 8 Years |
| Fall 2008 | 83% | 85% | 85% |
| Fall 2009 | 82% | 85% | 85 |
| Fall 2010 | 76% | 78% | 78% |
| Fall 2011 | 78% | 81% | 81% |
| Fall 2012 | 81% | 84% | 84% |
| Fall 2013 | 88% | 88% | 88 |
| Fall 2014 | 84% | 86% | 86% |
| Fall 2015 | 91% | 92% | 92% |
| Fall 2016 | 84% | 87% | 87% |
| Fall 2017 | 84% | 89% | 89% |
| Fall 2018 | 89% | 93% | |
| Fall 2019 | 91% | 95% | |
| Fall 2020 | 83% | ||
| Fall 2021 | 90% | ||
| Average | 85% | ||
Source: Regimental Information System
RETENTION AND GRADUATION RATES
| Entering Semester | Initial Cohort | 1st-to-2nd Fall Retention Rate | 4-Year Graduation Rate | 6-Year Graduation Rate | 8-Year Graduation Rate |
|---|---|---|---|---|---|
| Fall 2011 | 278 | 93% | 78% | 81% | 81% |
| Fall 2012 | 225 | 94% | 81% | 84% | 84% |
| Fall 2013 | 215 | 98% | 88% | 88% | 88% |
| Fall 2014 | 250 | 95% | 84% | 86% | 86% |
| Fall 2015 | 262 | 98% | 91% | 92% | 92% |
| Fall 2016 | 297 | 95% | 84% | 87% | 87% |
| Fall 2017 | 289 | 97% | 84% | 89% | 89% |
| Fall 2018 | 277 | 98% | 78% | 93% | |
| Fall 2019 | 265 | 100% | 91% | 95% | |
| Fall 2020 | 261 | 95% | 83% | ||
| Fall 2021 | 284 | 98% | 90% | ||
| Fall 2022 | 289 | 99% | |||
| Fall 2023 | 288 | 99% | |||
| Fall 2024 | 289 | 97% |
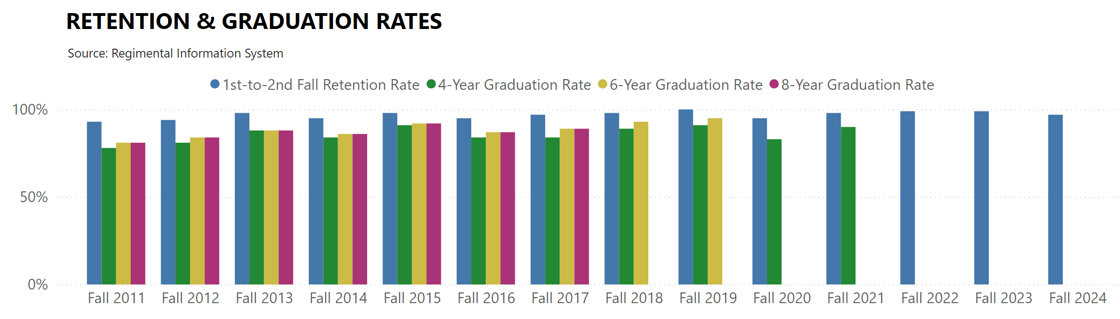
Source: Regimental Information System
STUDENT RIGHT-TO-KNOW DISAGGREGATED GRATUATION RATES
Percent of Students Graduating in 150% of normal time by entering cohort, disaggregating by gender and race/ethnicity
| Fall 2015 | Fall 2016 | Fall 2017 | Fall 2018 | Fall 2019 | |
|---|---|---|---|---|---|
| All Students | 92% | 87% | 89% | 93% | 95% |
| Gender | Fall 2015 | Fall 2016 | Fall 2017 | Fall 2018 | Fall 2019 |
| Men | 94% | 84% | 87% | 94% | 94% |
| Women | 89% | 91% | 92% | 91% | 96% |
| Race & Ethnicity | Fall 2015 | Fall 2016 | Fall 2017 | Fall 2018 | Fall 2019 |
| American Indian or Alaska Native | ** | ** | ** | ** | ** |
| Asian | 92% | 94% | 75% | 100% | 100% |
| Black or African American | 92% | 78% | 94% | 100% | 80% |
| Hispanic | 86% | 88% | 89% | 97% | 88% |
| Native Hawaiian or Pacific Islander | ** | ** | ** | ** | ** |
| Nonresident Alien | ** | ** | ** | ** | ** |
| Two or More Races | 96% | 91% | 96% | 91% | 100% |
| Unknown Race and Ethnicity | ** | ** | ** | ** | ** |
| White | 92% | 86% | 90% | 91% | 95% |
Source: Regimental Information System
EMPLOYMENT
Unless exceptional circumstances arise, USCG graduates are commissioned as Ensigns in thh United States Coadt Guard Academy with a service commitment of at least five years.
Percent of Graduates Commissioned as Ensigns (values rounded to the nearest %)
| Graduation Year | Percent Commissioned |
|---|---|
| 2025 | 97% |
| 2024 | 99% |
| 2023 | 100% |
| 2022 | 98% |
| 2021 | 99% |
| 2020 | 100% |
| 2019 | 99% |
| 2018 | 98% |
| 2017 | 99% |
| 2016 | 100% |
| 2015 | 100% |
| 2014 | 100% |
| 2013 | 100% |
| 2012 | 99% |
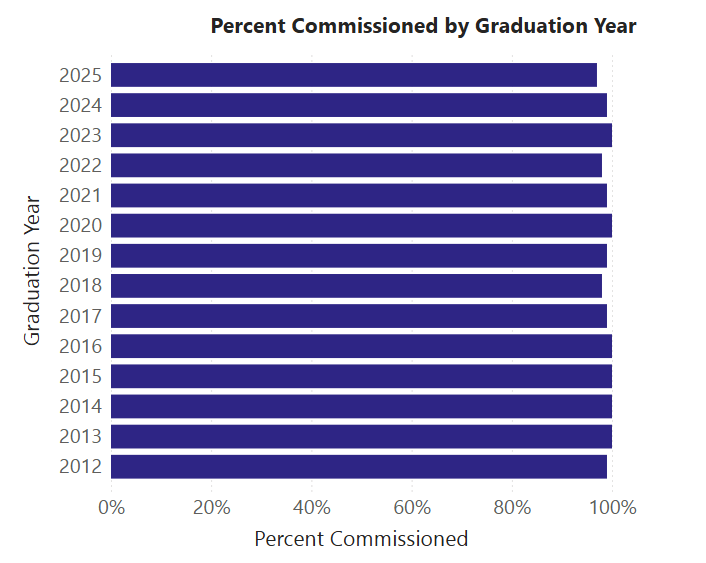
Source: Regimental Information System